DBMS
DBMS Part-1
- DBMS Introduction
- DBMS Architecture
- Database Approach vs Traditional File System
- Advantages of DBMS
- Data Models in DBMS
- Schemas in DBMS
- Instances in DBMS
- Data Independence in DBMS
- Database Languages in DBMS
- Interfaces in DBMS
- Structure of DBMS
- Functions of DBA and Designer
- Entities and Attributes in DBMS
- ER Diagram in DBMS
- Generalization, Specialization and Aggregation in DBMS
- Converting ER Diagram to Tables in DBMS
- Difference between Object Oriented, Network and Relational Data Models
DBMS Part-2
- Relational Data Model in DBMS
- Keys in DBMS
- SQL Introduction
- DDL(Data Definition Language)
- DML(Data Manipulation Language)
- Integrity Constraints in DBMS
- Complex SQL Queries
- Joins in DBMS
- Indexing in DBMS
- Triggers in DBMS
- Assertions in DBMS
- Relational Algebra in DBMS
- Tuple Relational Calculus in DBMS
- Domain Relational Calculus in DBMS
DBMS Part-3
- Introduction to Normalization in DBMS
- Normal Forms in DBMS
- Functional Dependency in DBMS
- Decomposition in DBMS
- Dependency Preserving Decomposition in DBMS
- Lossless Join Decomposition in DBMS
- Problems with Null Values and Dangling Tuples
- Multivalued Dependency in DBMS
- Query Optimization in DBMS
- Algorithms for Select, Project and Join Operations in DBMS
- Query Optimization Methods in DBMS
DBMS Part-4
- Transactions in DBMS
- Serializability in DBMS
- Recoverability in DBMS
- Recovery Techniques in DBMS
- Log Based Recovery in DBMS
- Checkpoint in DBMS
- Deadlock in DBMS
- Concurrency Control in DBMS
- Lock Based Protocol in DBMS
- Timestamp Based Protocol in DBMS
- Validation Based Protocol in DBMS
- Multiple Granularity in DBMS
- Multi-Version Concurrency Control(MVCC) in DBMS
- Recovery with Concurrent Transactions in DBMS
DBMS Part-5
E-R Diagram in DBMS
E-R Diagram kya hota hai?
E-R Diagram ka full form hai Entity-Relationship Diagram.
Ye ek drawing ya diagram hoti hai jo batata hai ki database ke objects (entities) ka data kya hai aur wo ek dusre se kaise jude hue hain (relationships).
Jaise architect ghar banane se pehle blueprint banata hai, waise hi database banane se pehle hum E-R diagram banate hain.
E-R Diagram ka use kyu hota hai?
Database ko visual form mein samajhne ke liye.
Entities, unke attributes aur unke beech ke relations ko dikhane ke liye.
Database design karne se pehle planning ke liye.
Developers aur stakeholders ke beech communication ke liye.
E-R Diagram ke Main Elements:
| Element | Hindi mein matlab | Symbol (Nishaan) |
|---|---|---|
| Entity | Real-world object jiska data chahiye | Rectangle |
| Attribute | Entity ka feature ya property | Oval |
| Relationship | Entity ke beech ka connection | Diamond |
| Primary Key | Entity ki unique pehchan | Underlined text |
| Multi-valued Attribute | Jisme ek se zyada values ho | Double Oval |
| Derived Attribute | Jo calculate karke milta hai | Dashed Oval |
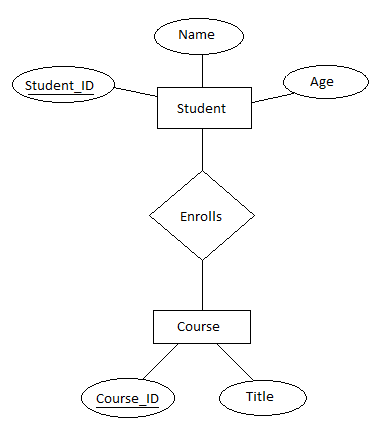
Example: University Database
Agar hum ek University ka database banayein:
Entities: Student, Course
Attributes:
Student → Student_ID, Name, Age
Course → Course_ID, Title
Relationship: Enrolls (Student enrolls in Course)
E-R Diagram:

Student aur Course do entities hain
Enrolls unke beech ka relationship hai
(Student_ID aur Course_ID Primary key hain)
Relationship Types
| Type | Meaning | Example |
|---|---|---|
| One-to-One (1:1) | Ek entity sirf ek dusri se judi hai | Student ↔ ID Card |
| One-to-Many (1:N) | Ek entity, kai dusri se judi hai | Teacher → Multiple Students |
| Many-to-Many (M:N) | Dono side kai entries hain | Students ↔ Courses |
Kaise banayein E-R Diagram?
1. Entities identify karo
Jaise: Student, Course, Book2. Attributes identify karo
Jaise: Student ke liye – Name, Age, ID3. Relationships dhoondo
Jaise: Student enrolls in Course4. Diagram draw karo
Rectangle = Entity, Oval = Attribute, Diamond = Relationship
E-R Diagram ke Fayde
-> Database ka structure easily samajh aata hai
-> Galti hone ka chance kam hota hai
-> Planning aur communication better hoti hai
-> Relational schema banane mein help milti hai
Quick Summary Table
| Cheez | Symbol | Example |
|---|---|---|
| Entity | Rectangle | Student, Book, Teacher |
| Attribute | Oval | Name, Age, Course_ID |
| Relationship | Diamond | Enrolls, Teaches, Issues |
| Primary Key | Underlined | Student_ID |
| Derived Attribute | Dashed Oval | Age (DOB se calculate hota hai) |
| Multi-valued Attr. | Double Oval | Phone Numbers |